Analyze TeleFipho data recorded by LabChart in pMAT software
If you want to analyze photometry data recorded by a third-party data recording system (e.g. LabChart software in PowerLab system / ADInstruments) in pMAT, the data has to be converted into a pMAT compatible CSV format. In addition to time stamps in the 1st column and photometry data in the 2nd column, so-called Control channel is required in the 3rd column. The Control channel in the 3rd column is an exponential trend line of the photometry data and it is used for delta F / F calculation. For more details about the Control channel, please see the YouTube tutorial below:
09-Generating a Control Channel – Barker Lab
https://www.youtube.com/watch?v=waV3u2CdsYk
Related article:
Analyze TeleFipho data in pMAT software
Most of commercial data acquisition system can generate ASCII format or CSV format data containing time stamps in the 1st column and photometry data in the 2nd column, however, the Control channel has to be manually added in Excel as you see in the tutorial movie above. To simplify this process, the “pMAT Converter†software would be useful.
Exporting photometry data in LabChart to pMAT compatible CSV
The Control channel in the 3rd column is an exponential trend line of the photometry data. If there are some artifacts caused by temporal data drop of transmission, the exponential trend line can be not accurate. In addition, if there are 0 values and/or minus values in the photometry data, the exponential trend line cannot be calculated (both in pMAT Converter and manual Excel calculation). Before exporting photometry data, these two factors have to be eliminated.
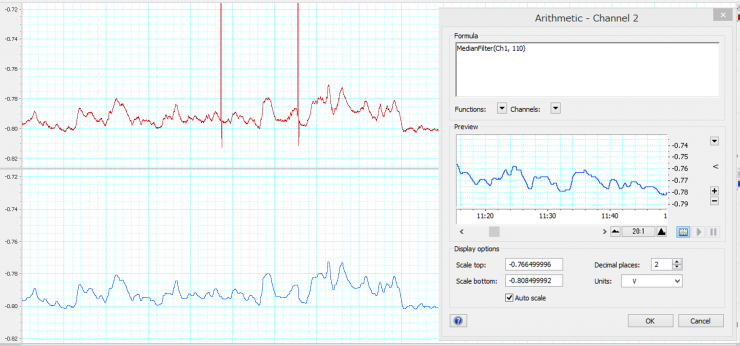
Regarding the artifact removal, the Median Filter function in LabChart is useful. Click the channel title at the right side to show pull-down menu, select “Arithmetic...â€. Type the following Formula as you see in the following image:
MedianFilter(Ch1, 110)
Click OK to apply, then the artifact will be removed. Here, the 2nd argument is sample number of the Median Filter window. Try from half of the sampling rate and gradually increase the value to see the artifact removal effect. In this example, the sampling rate of the data is 200Hz and the argument 110 is good enough to remove the artifact.
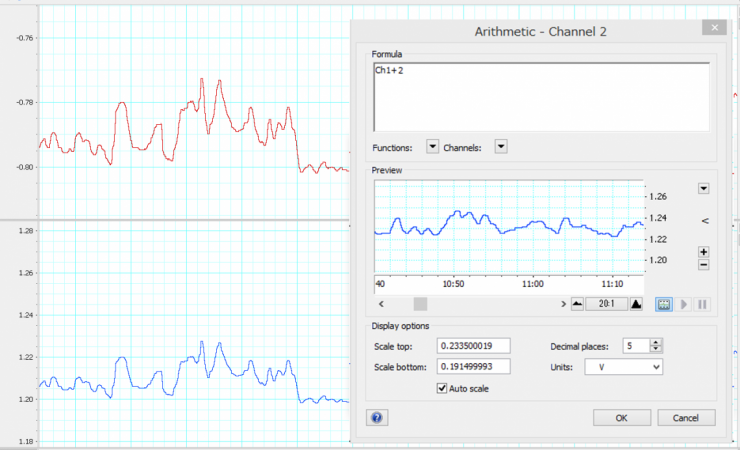
Regarding the 0 value and minus value handling, adding an offset value to the data is an easy solution. If you see 0 and/or minus values in the data and want to add an offset value 2 to the data, click the channel title at the right side to show pull-down menu, select “Arithmetic...â€, type the following Formula as you see in the following image:
Ch1+2
Click OK to apply, then the offset value 2 is applied to the whole data. (We recommend the value becomes more than 1 after applying the offset. If you see unreliable control channel, try multiplying by 10 ~ 100000 in Arithmetic function to get a big enough value.)
Both these two processes are achieved in the same Arithmetic dialog. If you type the following formula, both processes are done at the same time:
MedianFilter(Ch1, 110)+2
After these processes, you are ready to export the data.
In the LabChart Chart view, Click and Drag the data you want to export. Click the menu, “File†-> “Export...†and specify the saving name and directory. In the next “Export As Text†dialog, set the check boxes as follows:
Check “Current selectionâ€
Uncheck “Block headerâ€
Check “Time†and “Always secondsâ€
Uncheck “Dateâ€, “Comments†and “Event markersâ€
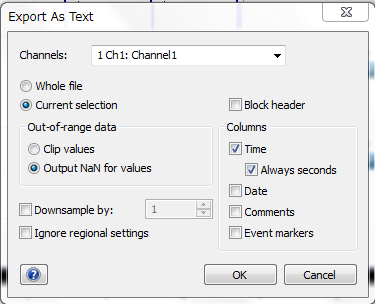
Click OK, then the data can be exported as Text format (extension: .txt)
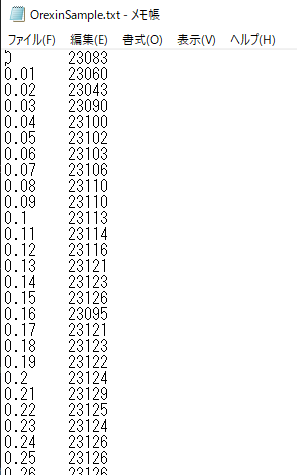
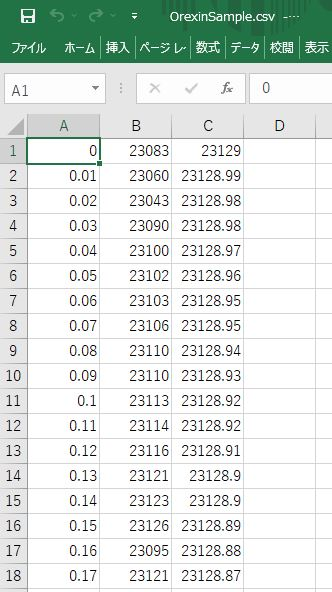
This tab-delimited text file contains time stamps in the 1st column and photometry data in the 2nd column. Other data acquisition systems’ text data having this format can be read in pMAT Converter as well. The letters of the file name has to be half-sized alphabet or number. The path and directory containing the data file should only have alphabet or number as well. Otherwise pMAT Converter cannot handle the file.
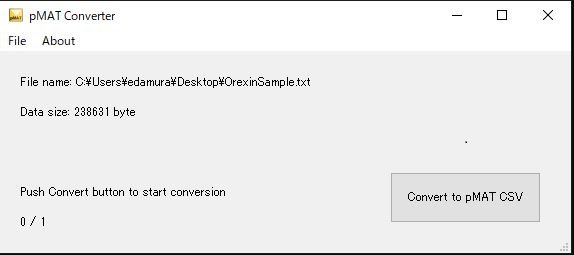
Double click the shortcut icon of pMAT to boot up the pMAT Converter software. In the menu, click “File†-> “Open†and select .txt format file(s) you want to convert. pMAT Converter can batch-process multiple files – hold Shift or Ctrl key, select multiple files and click Open. Click “Convert to pMAT CSV†to start the conversion process. You’ll see converted CSV files in the same directory.
If you open the CSV file in Excel etc, you’ll see the Control channel added to the 3rd column. Now this file can be read in pMAT.
Exporting event data recorded in LabChart
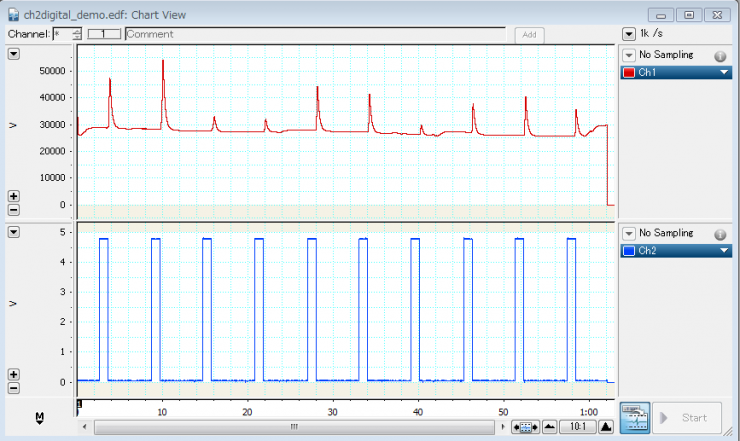
pMAT requires Event data for analyzing Peri-Event Time Histgrams (PETH), etc. After reading the photometry data CSV file, pMAT requires an Event data CSV file. (Even if you don’t analyze PETH etc., still you need to prepare a dummy CSV Event data.) There are various ways to record event data in LabChart, here we instruct assuming a data file containing photometry data in Ch1 and event data in Ch2, like this:
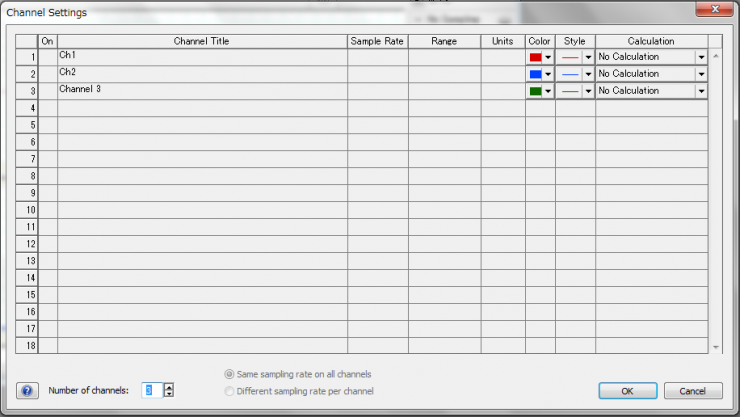
Click menu “Setup†-> “Channel Settings...†to open Channel Settings dialog. Change the “Number of channels†to “3â€, click OK, then you’ll see an empty channel 3 appears.
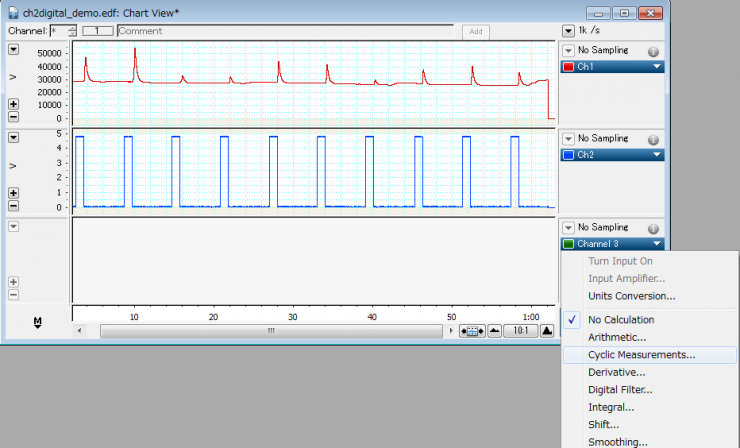
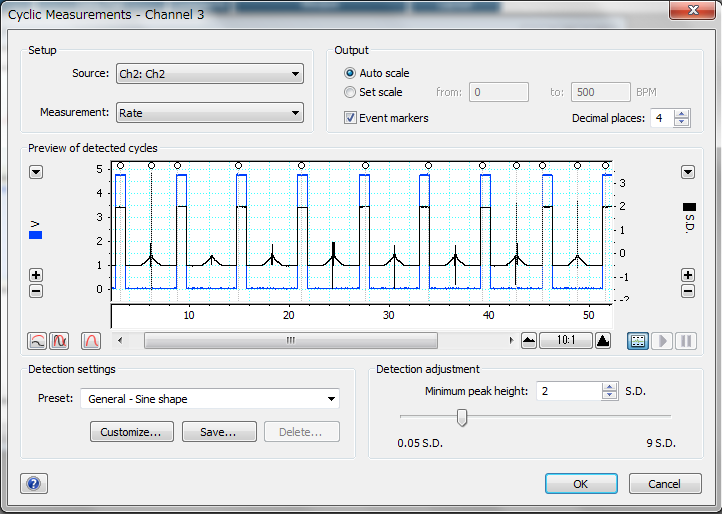
Click the title of channel 3 at the right side to show pull-down menu and select “Cyclic Measurements...â€. Cyclic Measurements dialog appears.
Change the “Source:†to Ch2 (event channel) and check “Event markersâ€. Click “Customize...†button at the bottom-left.
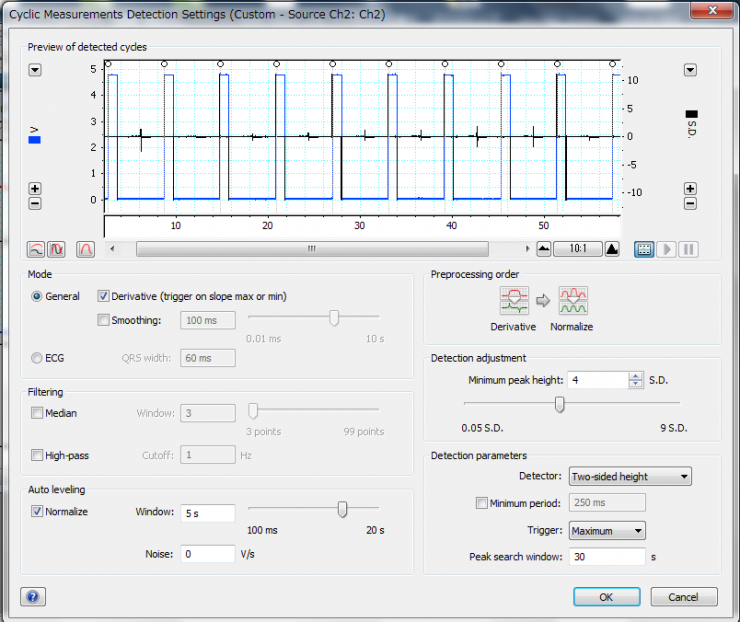
Check the “Derivative (trigger on slope max or min)â€. Adjust the “Detection Adjustment†bar so that all event markers come at the rising edges of the even pulses. Click OK to apply.
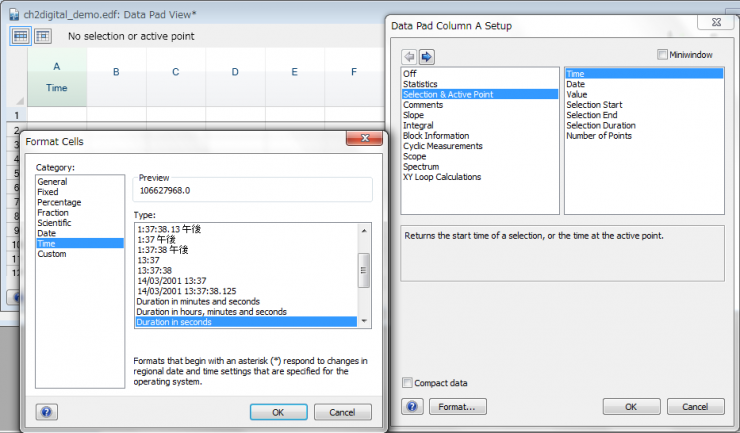
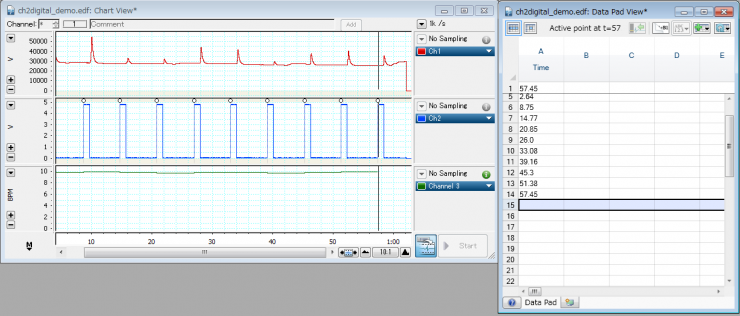
Click menu “Window†-> “Data Pad†to open data pad. Click the title of column A to open “Data Pad Column A Setupâ€. Select “Selection & Active Point†in the left side list and “Time†in the right side. Click “Format...†button at the bottom-left to open “Format Cells†dialog. Select “Time†in the left “Category:†and “Duration in seconds†in the right “Type:â€. Click OK to apply.
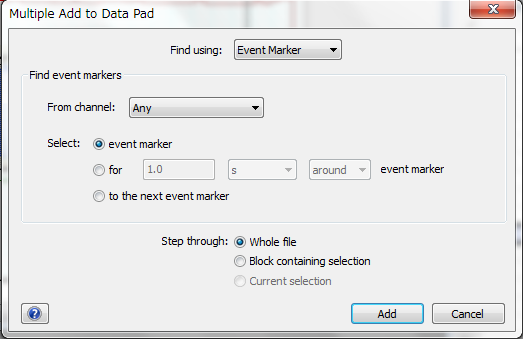
Click menu “Command†-> “Multiple Add to Data Pad…†to open Multiple Add to Data Pad dialog.
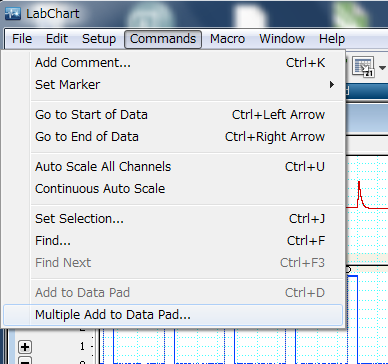
Change the “Find using:†to “Event Markerâ€. Click Add to execute.
Now you see time stamps of the event markers. Drag the numbers and copy them by pressing keyboard Ctrl + C.
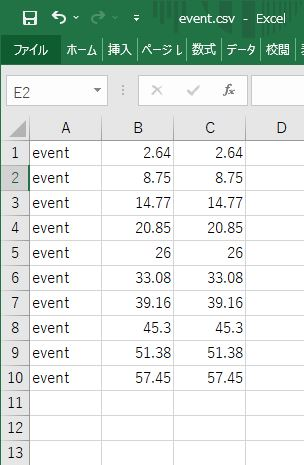
Open Excel etc. Paste the time stamps in column B and C by pressing keyboard Ctrl + V. Column B and C are filled with the same values. Fill all column A cells with an event name. Save the file in CSV format from menu “File†-> “Save Asâ€, selecting “Save as type:†as CSV UTF-8(Comma delimited)(*.csv). Now this CSV file can be load in pMAT as an event data.
This LabChat settings can be saved as a setting file (extension: .adiset). From the next time, double click the setting file to open the setting, start data recording or append existing data to the setting by opening it from the menu “File†-> “Append…†to apply the settings.
Load photometry and event data in pMAT
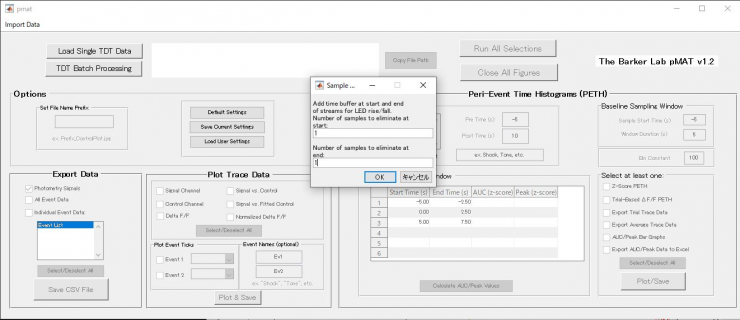
Start pMAT software. Select “Import Data†→ “Import CSV Files†to open “Open Recording File†window and select the photometry data exported to CSV. Next, you need to enter number of samples to eliminate at start and end. The number 0 is not accepted here, so enter 1 and click OK.
Next, you need to select the event data exported to CSV in “Open Event/Behavior Fileâ€. Now, data loading steps are finished.
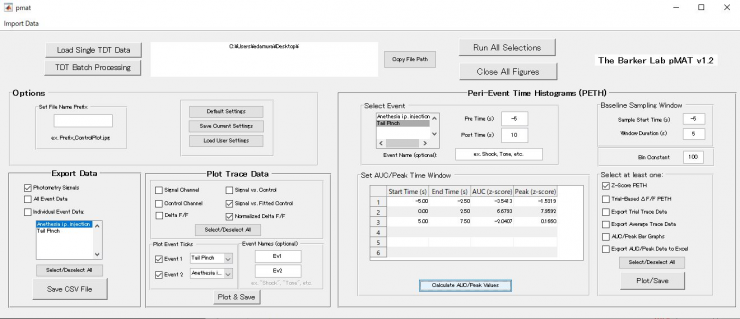
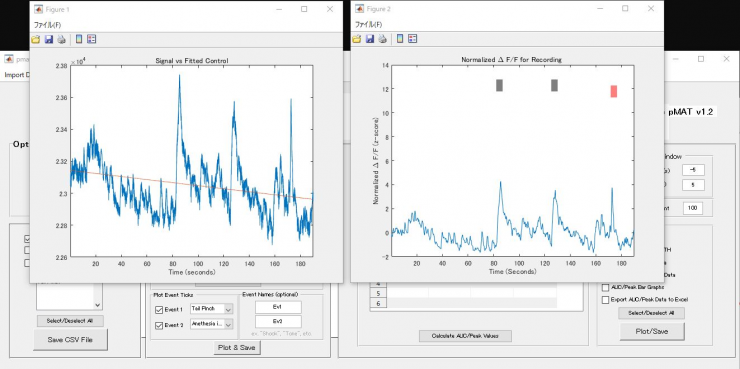
Check e.g. “Signal vs. Fitted Control†and “Normalized Delta F/F†in the Plot Trace Data category, check Event 1 and select an event in the pull-down menu. If there are multiple events, the Event 2 should be checked and another event should be selected in the pull-down menu, too.
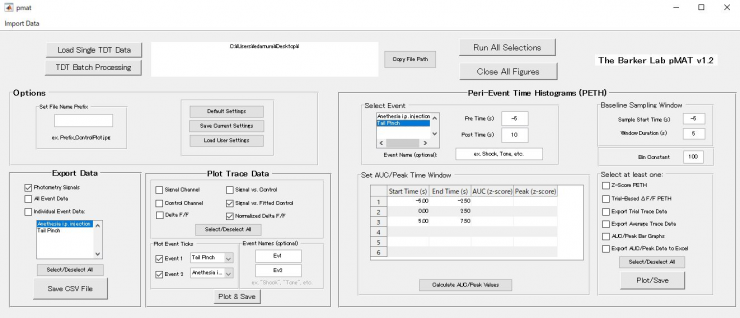
Click “Plot & Save†button. The checked “Signal vs. Fitted Control†and “Normalized Delta F/F†plots are generated.
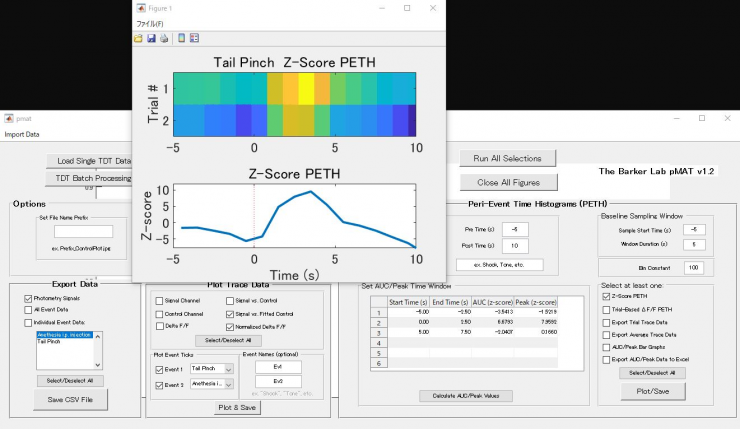
Click “Calculate AUC/Peak Values†in the “Peri-Event Time Histograms (PETH)†category. Check e.g. “Z-Score PETH†in the “Select at least one†category, and click “Plot & Save†button. The checked “Z-Score PETH†plot is generated.