Analyze TeleFipho data in pMAT software
pMAT is an open-source software for fiber photometry analysis developed by Dr. David Barker in Rutgers University. pMAT is compatible with various fiber photometry systems from various vendors, because it can read photometry data / event data converted to CSV format. Anyone can immediately download and try pMAT from the GitHub link below. There are Independent Development version which can be installed in Windows or Mac PC, and Matlab source version which requires Matlab:
pMAT (Photometry Modular Analysis Tool) – djamesbarker / pMAT
https://github.com/djamesbarker/pMAT
For more details about pMAT, please see the publication below:
pMAT: An Open-Source Software Suite for the Analysis of Fiber Photometry Data
https://www.ncbi.nlm.nih.gov/pmc/articles/PMC7853640/
There is a dedicated YouTube channel for the pMAT tutorial. You can quickly learn the basics here:
pMAT Tutorials – Barker Lab
https://www.youtube.com/watch?v=-pmzwPBfRGQ&list=PLUej2ATvfcttc41wCPWJGxLGIwG31mG3o
Here, we instruct how TeleFipho data can be exported and analyzed in pMAT (tested in TeleFipho software version 1.9.3 and pMAT Independent Development version 1.2)
Exporting Photometry Data
The following two new features are added to the TeleFipho software v1.9.3:
- Export Data for pMAT
- Export Event for pMAT
Now you can export the photometry data and comment-based event data to CSV files which can be directly read by pMAT.
Before exporting the data, please check the following two parameters in Preference window which can be opened from Setup -> Preference. These are important for generating Control channel used for delta F / F calculation in pMAT:
- Initial Elimination Samples for pMAT
- End Elimination Samples for pMAT
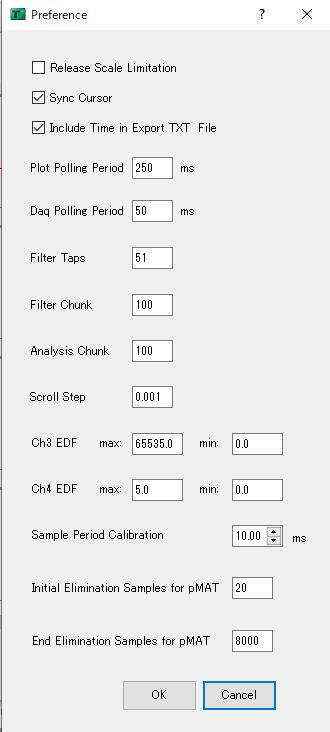
- Initial Elimination Samples for pMAT (default: 20)
Set initial sample points excluded from the exported data. Normally TeleFipho takes ~0.15 seconds to establish communication from the starting point. During this period, you see the value 32768 and these sample points should be excluded for generating proper Control channel for delta F / F calculation. For example, if you set the value as 20, the initial 0.2 seconds of sample points are excluded from the exported CSV file (because of the fixed 100Hz sampling rate in TeleFipho, 20 * 0.01 = 0.2 seconds).
This is the same function with the “Number of samples to eliminate at start:†in pMAT.
- End Elimination Samples for pMAT (default: 0)
Set end sample points excluded from the exported data.
This is the same function with the “Number of samples to eliminate at end:†in pMAT.
Export the photometry data to CSV from “File†-> “Export Data for pMAT...â€
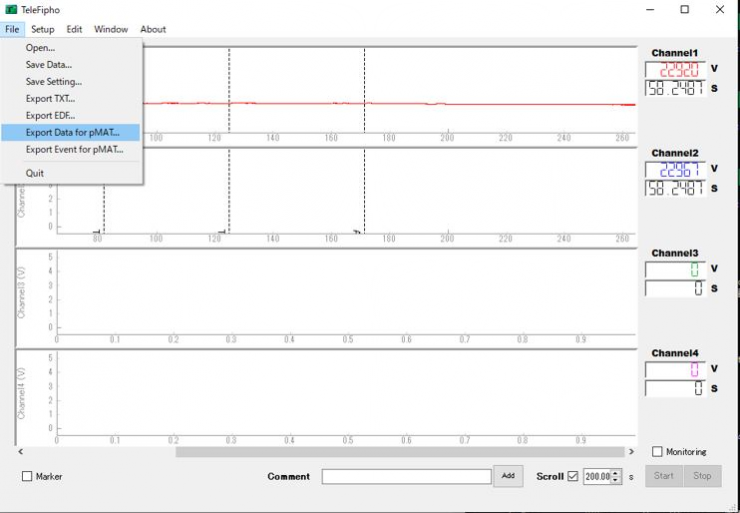
The exported CSV file has time stamps in the 1st column, photometry data in the 2nd column and Control channel in the 3rd column. This is pMAT compatible format so pMAT can directly read the CSV file.
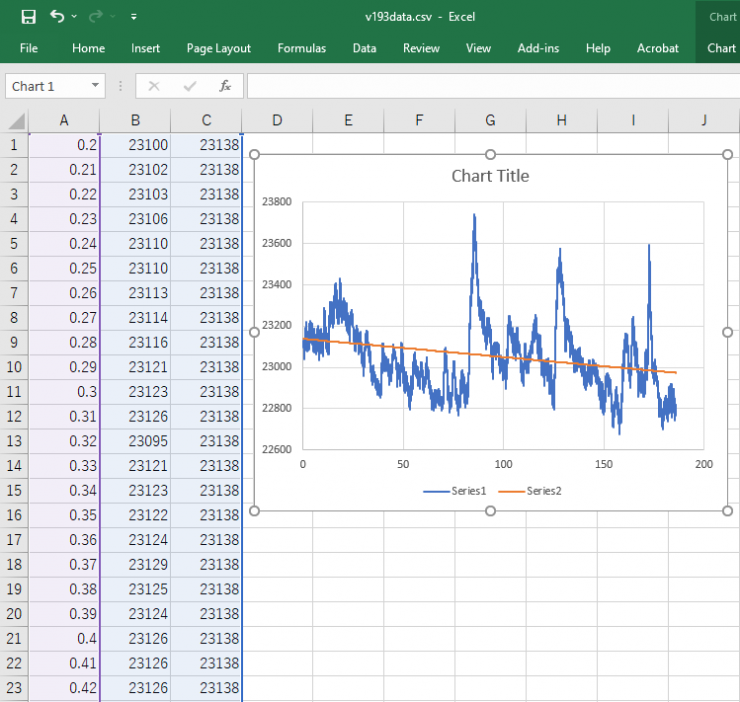
The Control channel in the 3rd column is an exponential trend line of the photometry data and it is used for delta F / F calculation. For more details about the Control channel, please see the YouTube tutorial below:
09-Generating a Control Channel – Barker Lab
https://www.youtube.com/watch?v=waV3u2CdsYk
Exporting Event Data
There are two different ways to record events in TeleFipho software.
1. Exporting events recorded by the “Comment†function
2. Exporting events recorded in the analog channel as digital pulses.
1. Exporting events recorded by the “Comment†function
In the TeleFipho software v1.9.3, the comments can be directly exported to pMAT compatible CSV format, so you don’t need any workaround in Excel.
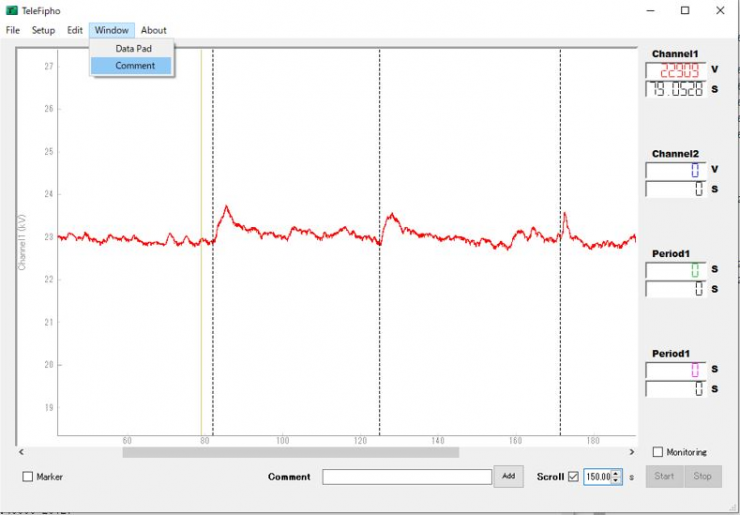
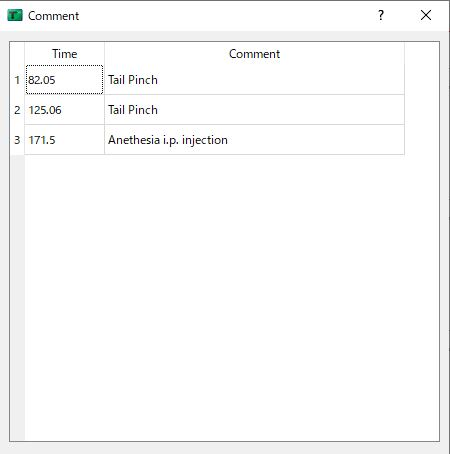
Click “Add†button at the bottom of the TeleFipho software during the recording at the event timing. A dotted line and a text comment is shown on the plot and the time stamp is recorded together. Alternatively, you can add comments at any position after the recording, by setting a cursor on the plot and click “Add†button. You can see all the comment list in the Comment window accessible from the menu Window -> Comment.
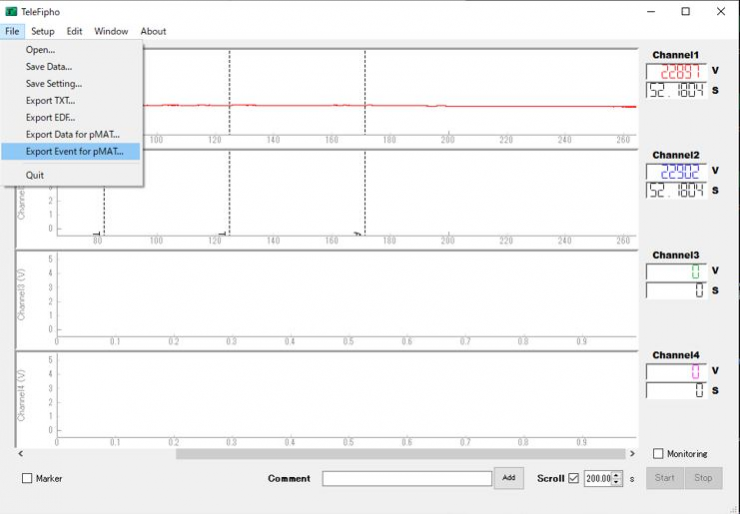
Export the comment-based events to CSV from “File†-> “Export Events for pMAT...â€
Please change the CSV file name and make it unique if you successively export the photometry data and the events data, to avoid overwriting.
The exported CSV file has event names in the 1st column and event time stamps both in the 2nd and 3rd column. The values in the 2nd and 3rd column are identical. The 2nd and 3rd column are the event onset and offset respectively, however, pMAT v1.2 does not use event offset for analysis, so the same values in both columns are OK.
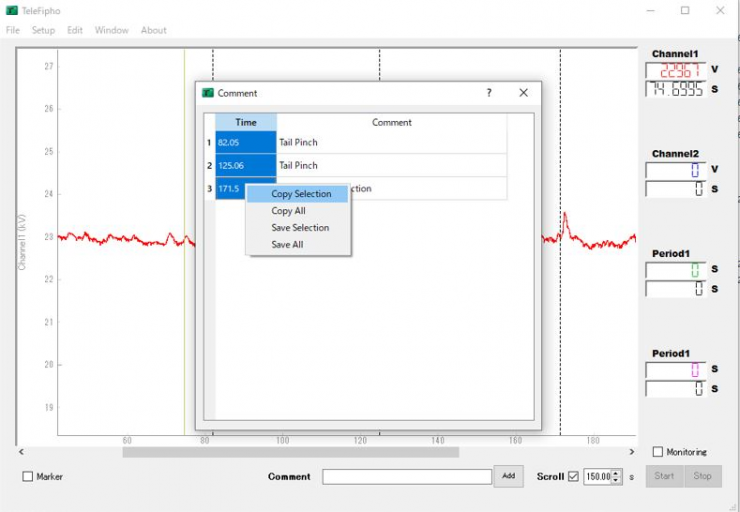
Alternatively, you can manually copy and paste the texts in the Comment window to Excel spreadsheet and save it in CSV format, by right-click -> Copy Selection.
2. Exporting events recorded in the analog channel as digital pulses.
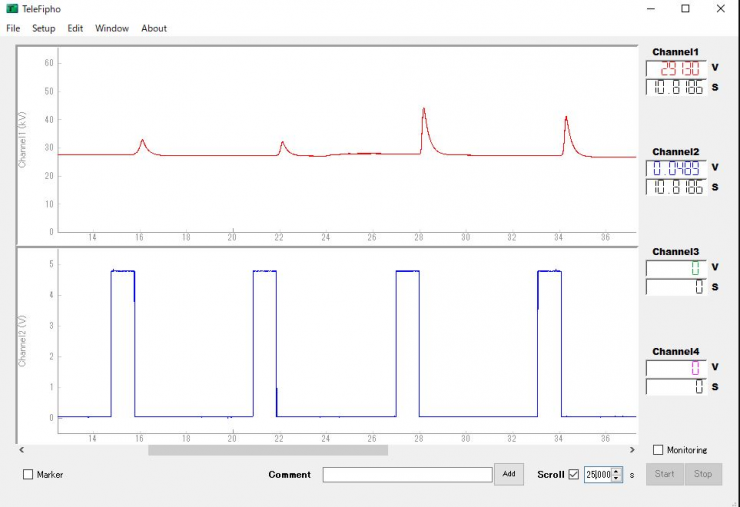
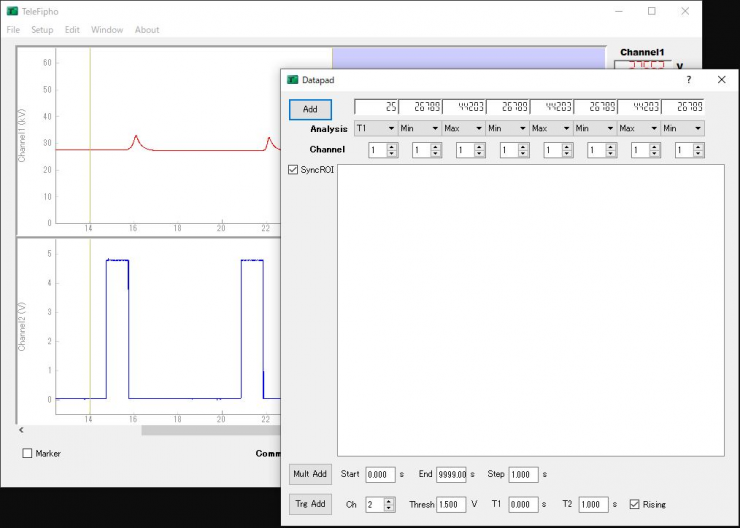
TeleFipho’s analog input is activated if you set the Ch Number as “2†in the Channel Settings window accessible from the menu Setup -> Channel Settings. You can connect a signal source to the analog input BNC (labelled as A-IN) and record analog signal in the range of 0 ~ 5V. You can for example record 3.3V or 5V TTL pulses from an external device indicating event timings. Here, Channel 1 is photometry data and Channel 2 is event TTL pulses recorded in the analog input, as you can see in the image below.
You can export the Channel 2 waveform to TXT format from the menu File → Export TXT... and may look for the rising timing, however, here we introduce a useful way to extract the rising time stamps by Data Pad function in the TeleFipho software.
To open the Datapad window, select menu Window → Data Pad.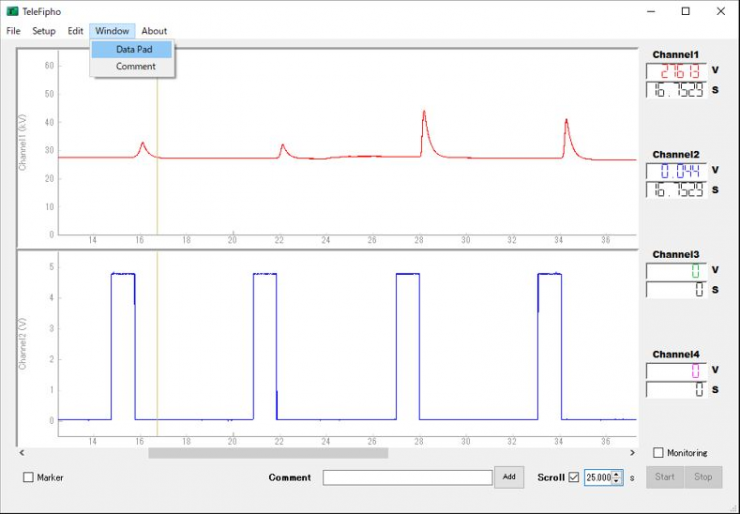
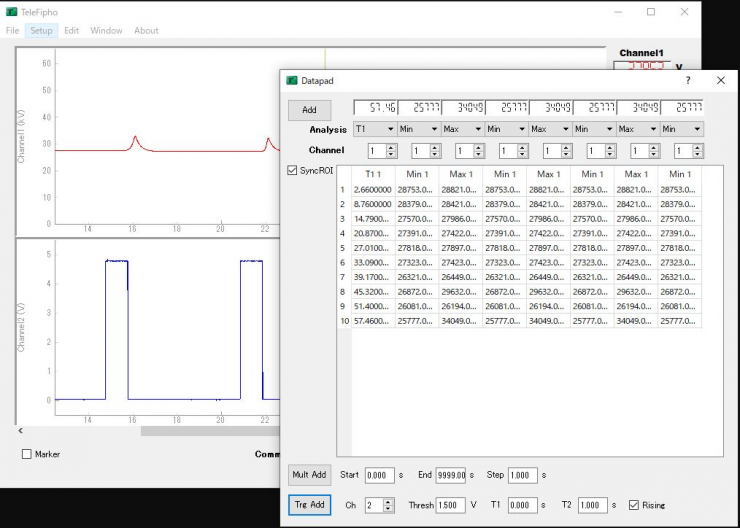
The “Trg Add†function can be used to detect rising timings by a specified threshold. Change the Ch value to “2†next to the Trg Add button. Make sure the Thresh value is 1.500V, T1 is 0.000s and “Rising†checkbox is checked. Normally digital pulses are 5V or 3.3V so this default 1.5V of the threshold is OK.
Change the leftmost Analysis pull-down menu to “T1â€. T1 is set to 0.000s meaning the detection time point.
Click “Trg Add†button. The rising time points are automatically detected from the start to the end of the data and added to the Datapad. The leftmost T1 column contains the rising time stamps.
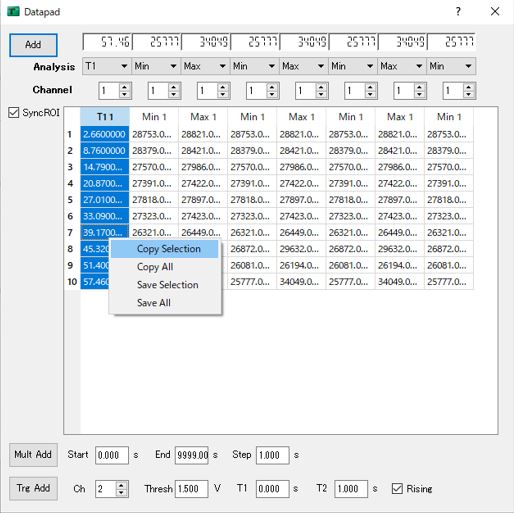
Click & Drug the T1 cells to select a set of time stamps. Select “Copy Selection†from the right-click menu. The time stamps are copied to clipboard.
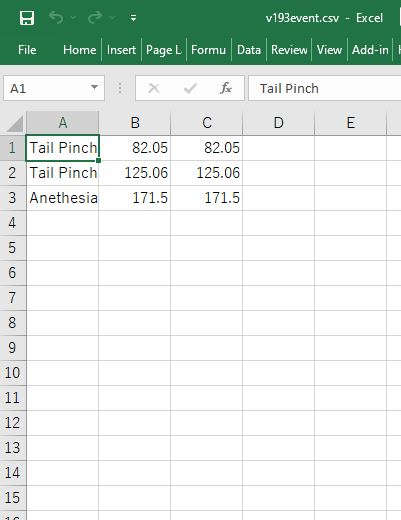
Open a new document in a spreadsheet software e.g. Microsoft Excel, paste the time stamps in column B and C by keyboard Ctrl + V. Column B and C are filled with the same values. Fill all the column A cells with an event name.
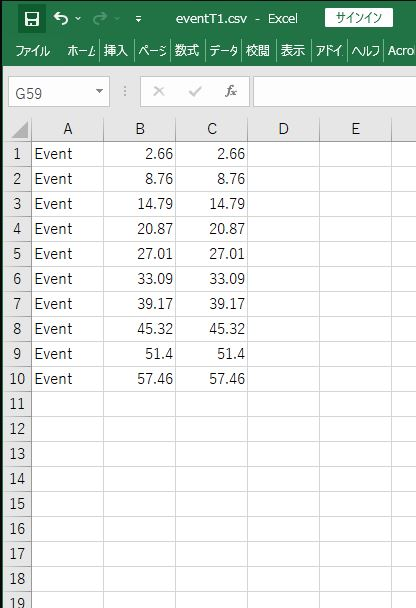
Save the spreadsheet in CSV format. In Excel, menu File -> Save As, Save as type: CSV UTF-8 (Comma delimited)(*.csv). Now this CSV file can be load in pMAT as event data.
Load photometry and event data in pMAT
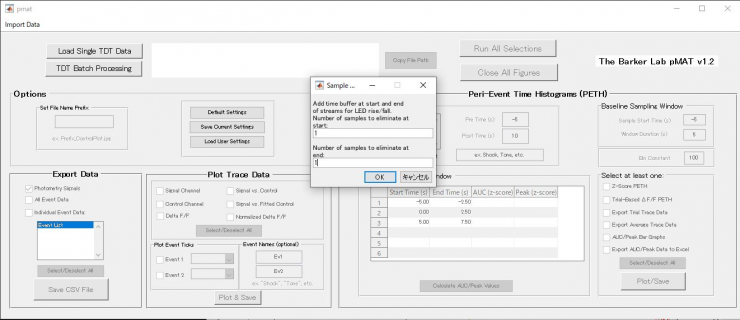
Start pMAT software. Select “Import Data†→ “Import CSV Files†to open “Open Recording File†window and select the photometry data exported to CSV. Next, you need to enter number of samples to eliminate at start and end. The number 0 is not accepted here, so enter 1 and click OK.
Next, you need to select the event data exported to CSV in “Open Event/Behavior Fileâ€. Now, data loading steps are finished.
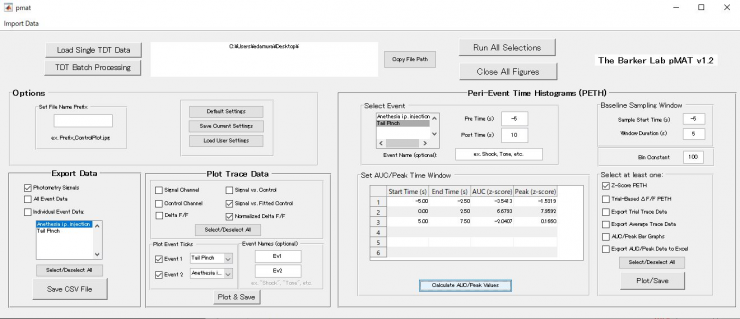
Check e.g. “Signal vs. Fitted Control†and “Normalized Delta F/F†in the Plot Trace Data category, check Event 1 and select an event in the pull-down menu. If there are multiple events, the Event 2 should be checked and another event should be selected in the pull-down menu, too.
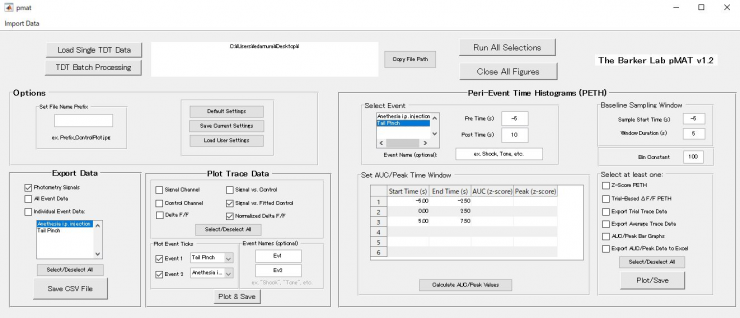
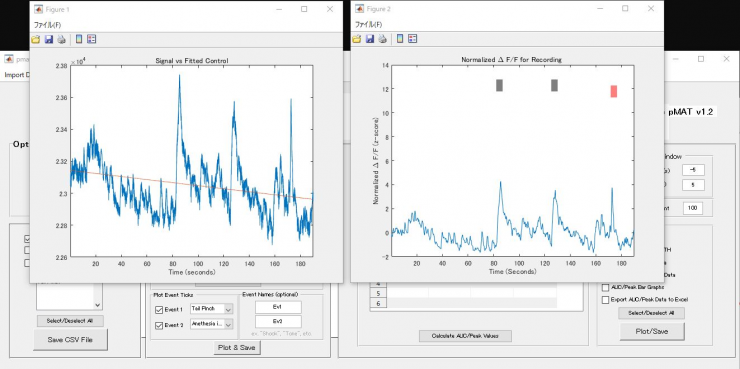
Click “Plot & Save†button. The checked “Signal vs. Fitted Control†and “Normalized Delta F/F†plots are generated.
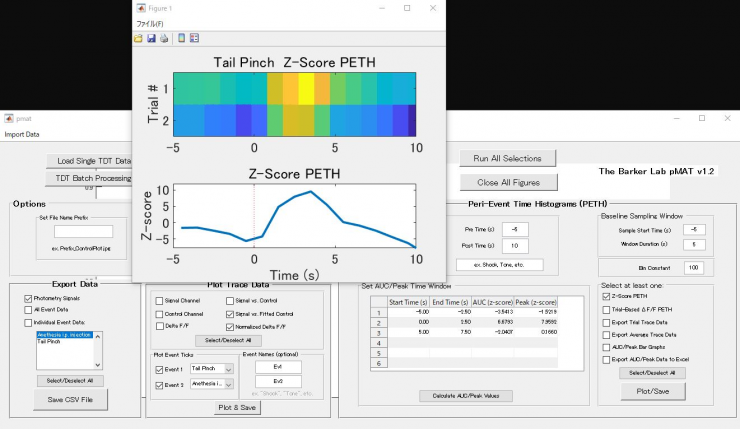
Click “Calculate AUC/Peak Values†in the “Peri-Event Time Histograms (PETH)†category. Check e.g. “Z-Score PETH†in the “Select at least one†category, and click “Plot & Save†button. The checked “Z-Score PETH†plot is generated.